Introduction to Forex Indicators
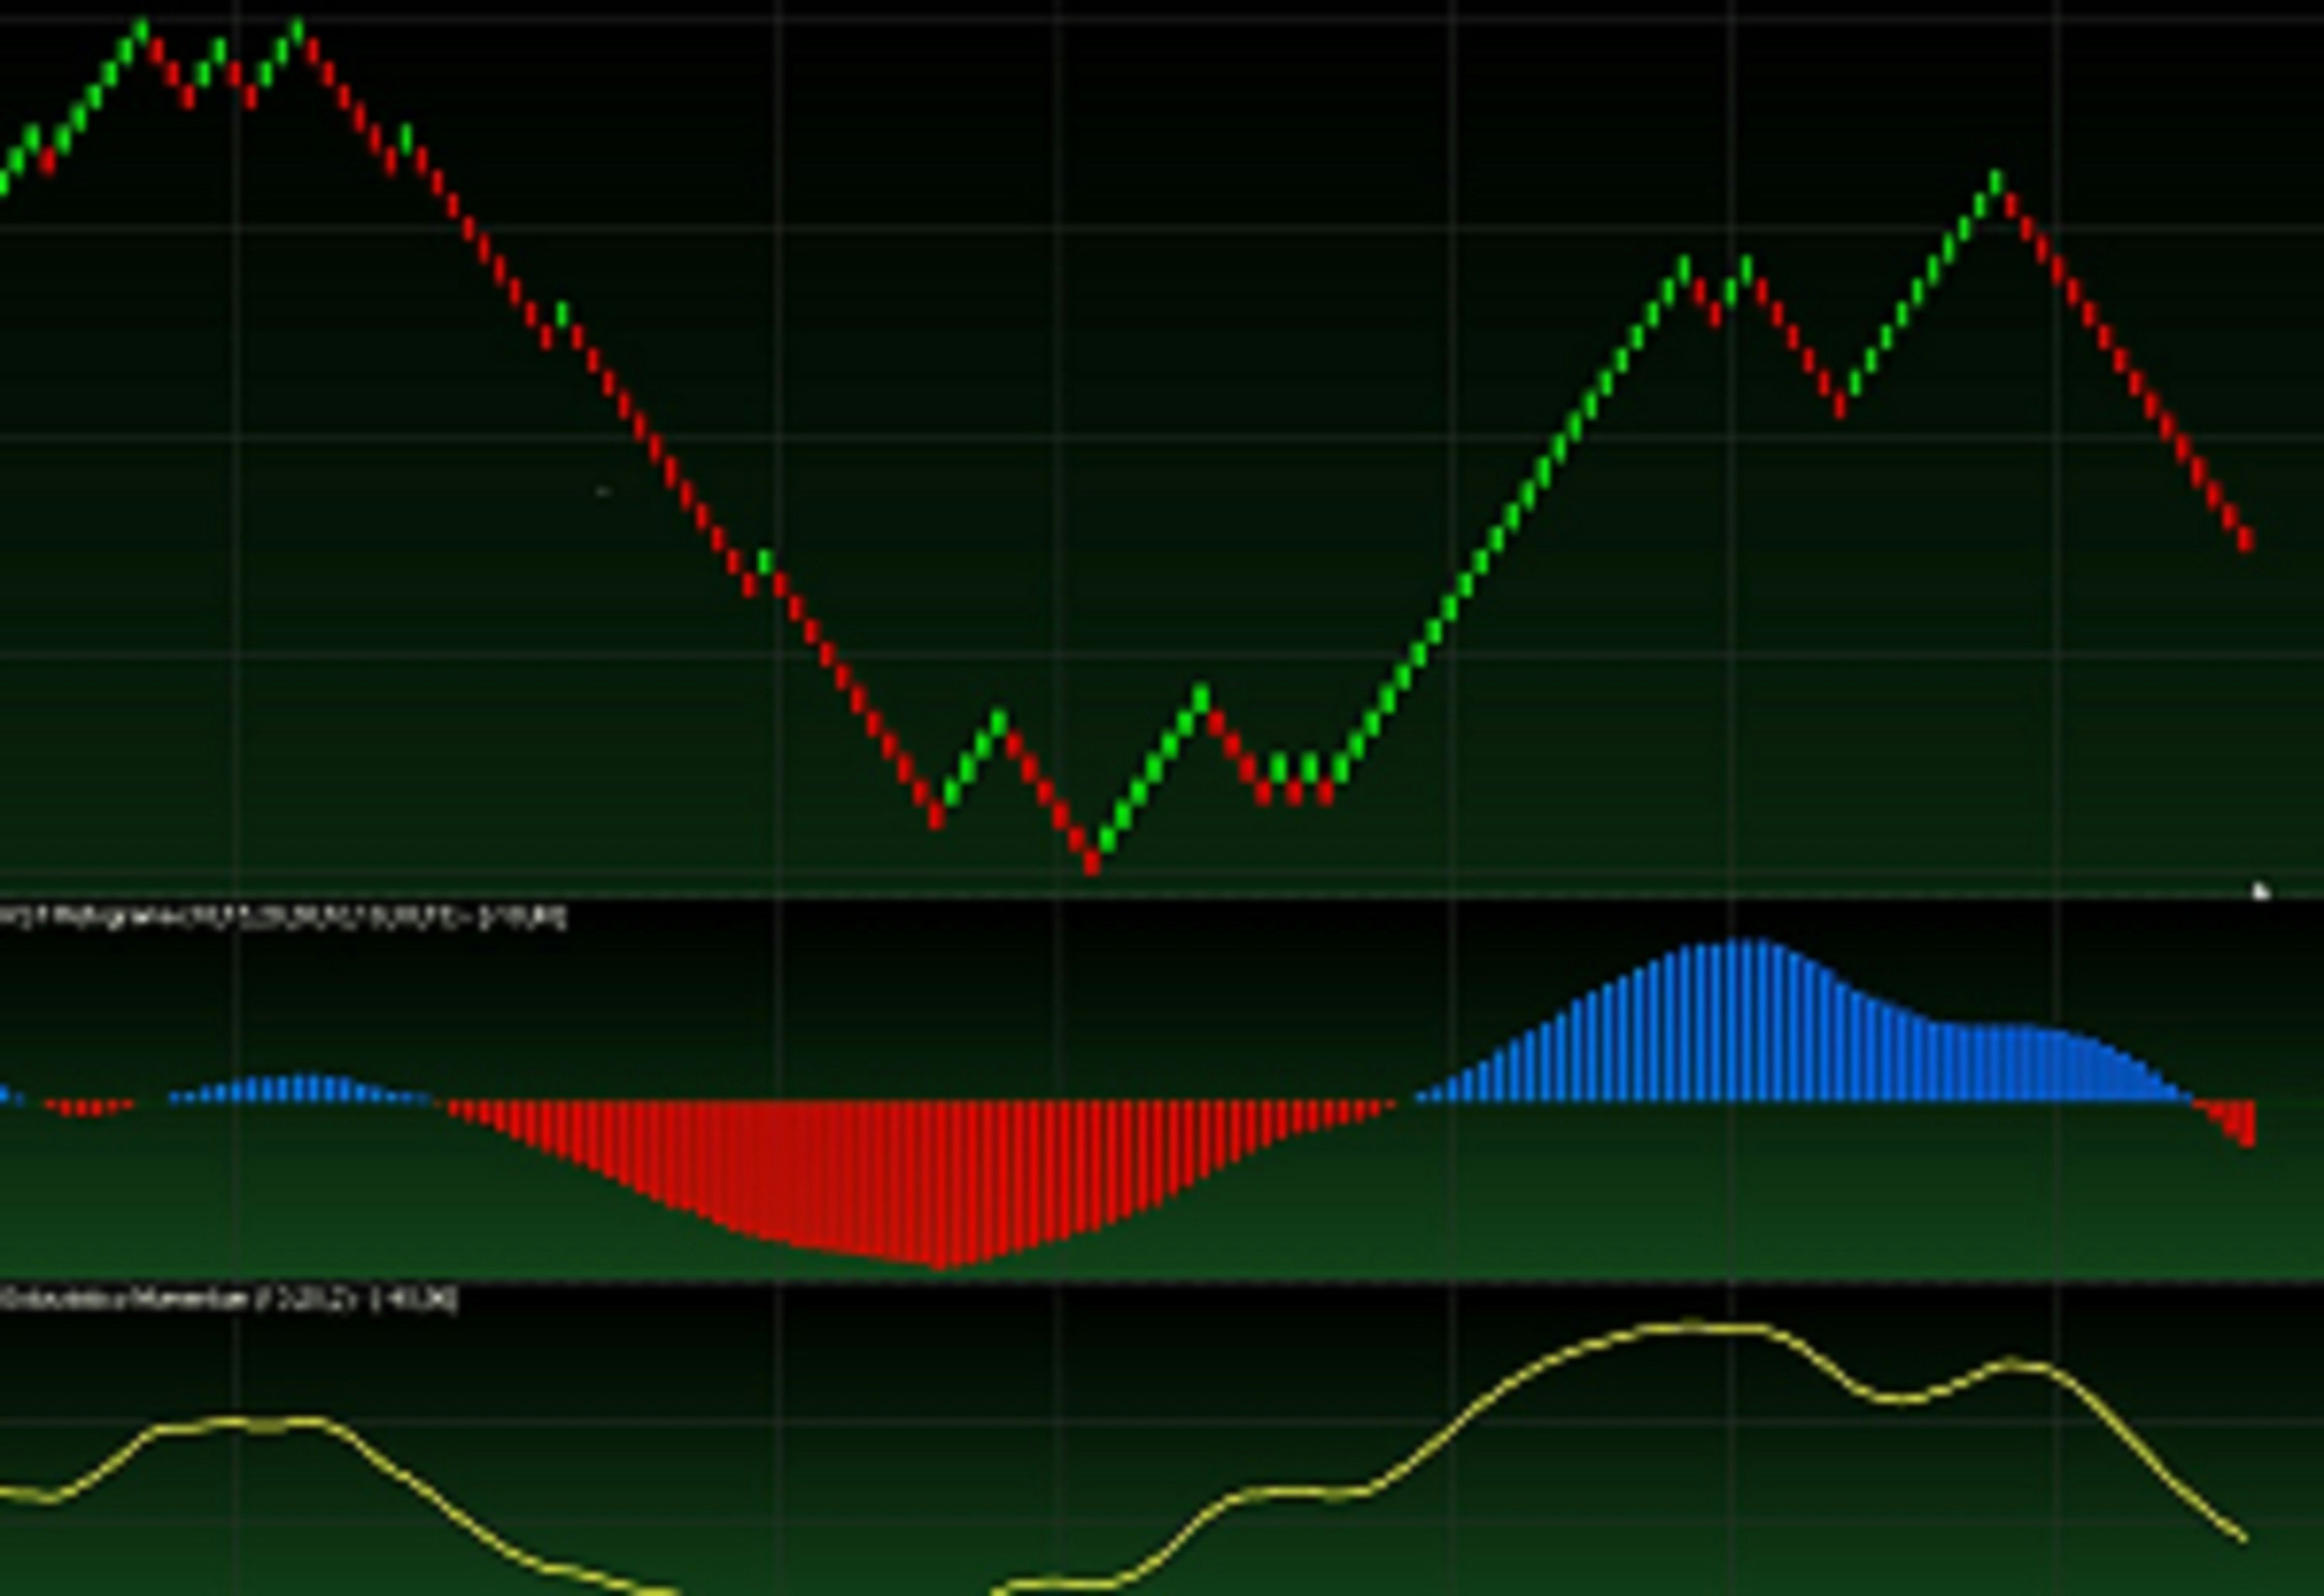
Forex indicators play a pivotal role in the world of trading by providing traders with tools to analyze market conditions and make informed decisions. These indicators are quantitative metrics designed to gauge various aspects of price movements, market trends, and underlying market sentiment. Their crucial importance lies in their ability to help traders formulate strategies based on statistical evidence rather than intuition alone.
Traders who engage in the foreign exchange market, often referred to as Forex, rely heavily on these indicators to assess potential entry and exit points for their trades. By analyzing trends and patterns presented by these indicators, traders can develop a clearer picture of market behavior and mitigate risks associated with price fluctuations. Forex indicators generally fall into two principal categories: leading indicators and lagging indicators.
Leading indicators are designed to predict future price movements, offering insights ahead of a trend’s onset. These are particularly useful for traders looking to capitalize on emerging opportunities. Examples of leading indicators include the Relative Strength Index (RSI) and Stochastic Oscillator, which help assess overbought or oversold conditions in the market, thereby guiding traders in timing their trades more effectively.
On the other hand, lagging indicators provide insights based on historical price data, confirming trends only after they have occurred. These indicators, such as Moving Averages and the Moving Average Convergence Divergence (MACD), are used to confirm trends and provide a smoother perspective on price action, often assisting traders in determining the strength of a trend.
In summary, understanding the fundamental role of Forex indicators in trading is crucial for traders aiming to enhance their analysis and decision-making processes. By leveraging both leading and lagging indicators, traders can better navigate the complexities of the Forex market and improve their chances of success.
Moving Averages: The Foundation of Trend Analysis
Moving averages are fundamental tools in the realm of forex trading, primarily employed to assist traders in identifying prevailing trends and potential reversals. These indicators smooth price data over a specific period, allowing traders to observe the underlying direction of the market without the noise of daily fluctuations. The two most common types of moving averages are the Simple Moving Average (SMA) and the Exponential Moving Average (EMA).
The Simple Moving Average calculates the average price over a certain number of periods, giving equal weight to all data points within that timeframe. This makes the SMA an effective indicator of overall market trends; however, it may lag in responsiveness to sudden price changes. In contrast, the Exponential Moving Average assigns greater weight to more recent prices, thus providing a quicker reflection of market movements. Traders often prefer EMAs for short-term trading strategies due to their responsiveness.
Moving averages can be pivotal in strategizing trades, particularly through crossover techniques. A bullish signal is generated when a shorter-term moving average crosses above a longer-term moving average, indicating a potential upward trend. Conversely, a bearish signal occurs when the shorter-term moving average crosses below the longer-term average, signaling a possible downtrend. Additionally, the Moving Average Convergence Divergence (MACD) indicator, which utilizes moving averages to illustrate momentum, is instrumental in identifying potential buy and sell opportunities based on the convergence and divergence of these averages.
In the context of forex trading, integrating moving averages into trading strategies not only helps in detecting trends but also enhances decision-making capabilities. By utilizing both SMA and EMA alongside crossover strategies and MACD, traders are equipped to make more informed choices, thereby enhancing their overall trading effectiveness.
Relative Strength Index (RSI): Measuring Market Momentum
The Relative Strength Index (RSI) is a popular momentum oscillator utilized by traders to assess the velocity of price movements within the forex market. Developed by J. Welles Wilder, the RSI ranges from 0 to 100, with values typically interpreted within predefined thresholds to identify potential overbought or oversold conditions. Specifically, an RSI reading above 70 often indicates that a currency pair may be overbought, while a reading below 30 suggests that it may be oversold. These conditions can help traders make informed decisions regarding entry and exit points in their trading strategies.
Traders frequently employ the RSI to generate signals that complement their trading strategies. For instance, when the indicator moves above the 70 mark, it may signal a potential price correction or reversal, while a movement below 30 can indicate a buying opportunity as prices may rebound from oversold levels. This application allows traders to capitalize on market momentum by identifying when a price trend may be nearing its limit. Furthermore, the use of RSI can be integrated seamlessly with other indicators to enhance trading decisions. For example, combining the RSI with moving averages can provide more robust entry points.
Additionally, the concept of divergence in RSI is crucial for traders aiming to refine their market analysis. Positive divergence occurs when the price action creates lower lows while the RSI forms higher lows, potentially signaling an upcoming bullish reversal. Conversely, negative divergence appears when the price reaches higher highs while the RSI prints lower highs, suggesting a bearish reversal could be imminent. Thus, understanding and incorporating divergence into trading strategies offers traders a powerful tool to enhance predictive accuracy and reinforce their decision-making process in navigating forex markets.
Bollinger Bands: Understanding Market Volatility
Bollinger Bands are a widely utilized technical analysis tool in the forex trading sphere, designed to measure market volatility and indicate potential price movements. Created by John Bollinger in the 1980s, this indicator consists of three lines: the middle band, upper band, and lower band. The middle band is typically a simple moving average (SMA) calculated over a specified period, usually 20 days. The upper and lower bands are set a certain number of standard deviations away from the middle band, often set to two standard deviations. This configuration provides a dynamic range that adapts to prevailing market conditions.
The primary function of Bollinger Bands is to assess market volatility. When the distance between the bands narrows, it signals a period of low volatility, often termed a ‘squeeze.’ A squeeze is significant as it may precede a considerable price movement, either upwards or downwards. Traders often interpret this contraction in bandwidth as an opportunity for potential breakouts. Conversely, when the bands widen, it indicates increased volatility and may suggest that prices are moving sharply in either direction, guiding traders to exercise caution.
Incorporating Bollinger Bands into trading strategies can enhance decision-making. One common approach is the squeeze strategy, which involves entering a trade when the price breaks through the upper or lower band following a period of compression. Additionally, traders often use Bollinger Bands in conjunction with other indicators, such as the Relative Strength Index (RSI) or Moving Average Convergence Divergence (MACD), to confirm potential reversals or breakouts effectively. By analyzing the interaction between price action and the bands, traders can develop a well-rounded perspective on market conditions and make informed trading decisions.


